THE EARTH'S ENERGY BUDGET
The Earth has an “energy budget” consisting of incoming solar radiation and outgoing thermal (terrestrial) radiation. The sun is extremely hot and has lots of energy to give, so it gives off shortwave radiation in the form of ultraviolet (UV) rays (those which burn our skin) and visible light, because shortwave radiation contains higher amounts of energy. The Earth is much cooler, but it still emits radiation. The ground heats up and re-emits energy as longwave radiation in the form of infrared rays[1]. Once in the Earth’s atmosphere, clouds and the surface absorb the solar energy.
Courtesy the National Aeronautics and Space Administration (NASA), the Earth’s energy budget can be depicted as follows:
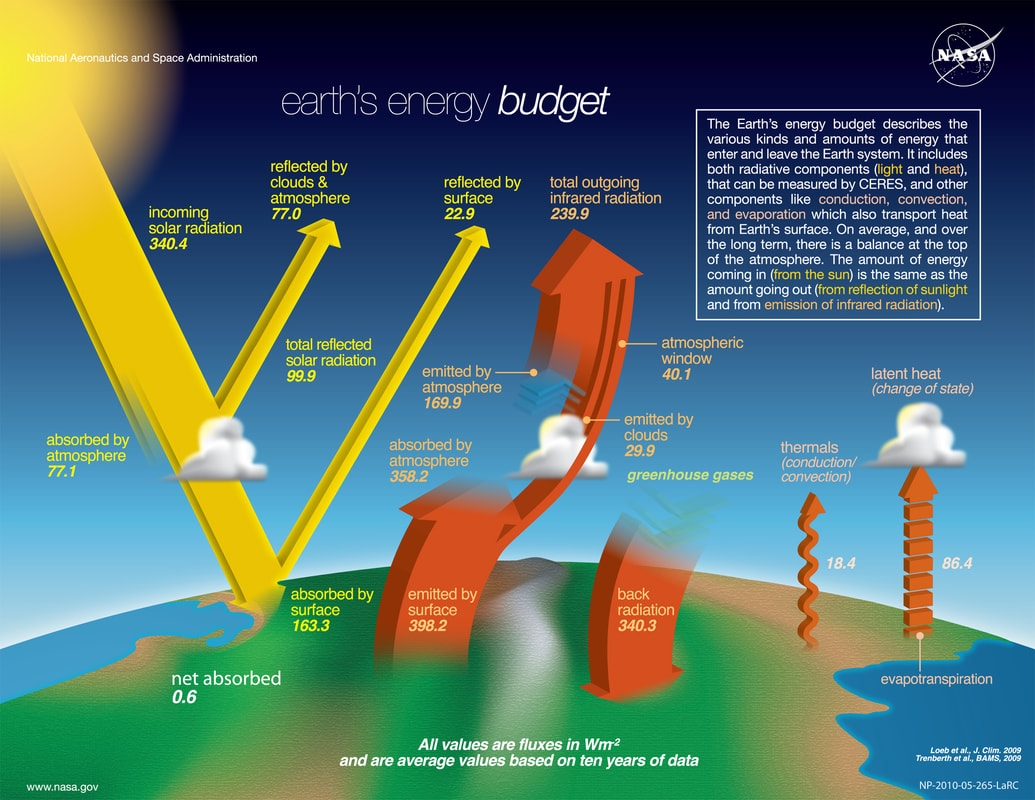
On the yellow indicators at the left of the diagram, 77 watts per square metre (w/m2) is reflected by clouds and the atmosphere and 22.9 w/m2 by the surface (ice, deserts etc). A further 77.1 w/m2 is absorbed by the lower atmosphere (water vapour). The remaining 163.3 w/m2 is absorbed at surface (especially ocean) level. W/m2 refers to the radiant flux (irradiance) received by a surface whose power comes from an energy source like our sun per unit area.
On the right side of the equation is the outgoing (thermal) radiation. We can see that 398.2 w/m2 is emitted by the surface, but only 40.1 escapes directly to space, while the rest is absorbed. Over a period then, the atmosphere emits 169.9 w/m2 back to space and 340.3 w/m2 back down to the surface. (The final two (non-radiative) terms over to the right represent thermals (conduction/convection) of 18.4 w/m2, and latent heat[2] (change of state from ice to water, water to steam etc) of 86.4 w/m2)[3]. When the Earth’s budget is doing as it should, its “effective temperature”[4] will remain in balance.
Radiative forcing, positive and negative
Radiative forcing (aka climate forcing) is the difference between shortwave radiation (sunlight) absorbed by the Earth and the energy radiated back to space[5]. Positive radiative forcing means Earth receives more incoming energy from sunlight than it radiates to space. This net gain of energy causes warming. Conversely, negative radiative forcing means that Earth loses more energy to space than it receives from the sun, which produces cooling. Increases in greenhouse gases (GHGs) will impact the outflow of longwave (terrestrial) radiation, resulting in a positive forcing.
Increases in aerosols will impact the inflow of solar radiation resulting in a negative forcing. In scientific parlance, aerosols (aka particulate matter) encompass particles, liquid droplets and mixtures in the atmosphere, which may be natural or anthropogenic. Examples of primary or natural aerosols include desert dust, sea salt fog, and geyser steam. Examples of artificial aerosols are haze, dust, particulate air pollutants and smoke[6]. Aerosols impact mainly shortwave radiation in two ways: firstly, by directly scattering solar radiation back to apace, and secondly by modifying the properties of clouds. Quantifying both of these can be problematic, but satellite data assists. To sum up, a positive forcing (incoming energy exceeding outgoing energy) warms the system; negative forcing (outgoing energy exceeding incoming energy) cools it[7].
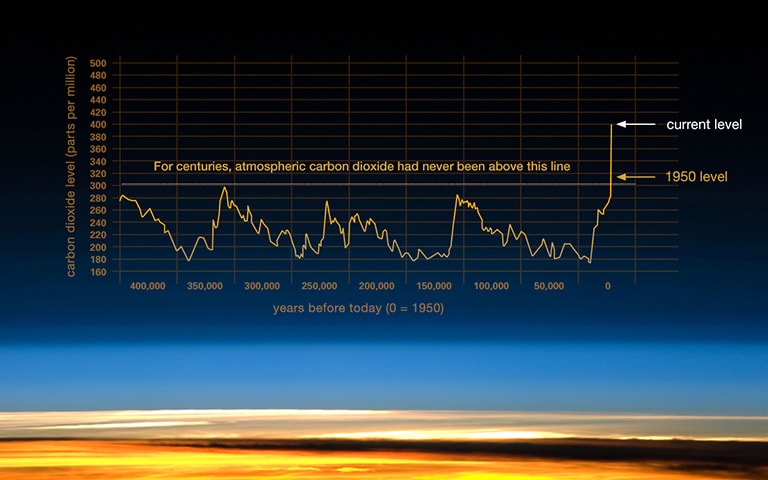
Over the last several hundred thousand years, CO2 levels varied in tandem with glacial cycles. During warm "interglacial" periods, CO2 levels were higher. During cool "glacial" periods, CO2 levels were lower. The heating or cooling of the Earth’s surface and oceans can cause changes in the natural sources and “sinks” of these gases, thus changing greenhouse gas concentrations in the atmosphere. These changing concentrations are thought to have acted as a positive feedback, amplifying the temperature changes caused by long-term shifts in the Earth’s orbit.
However, since the Industrial Revolution began around 1750, the so-called “greenhouse” (or “radiatively active”) gases (GHGs) - water vapour (H20)[8], CO2, methane (CH4), nitrous oxide (N2O), ozone (O3) and some man made gases such as the chlorofluorocarbons (HCFCs) - are the most common reason for climate change.
These are sometimes referred to as “trace gases” because they make up only a tiny fraction of the atmosphere, so small in fact that if you were to imagine one million molecules of air in a room, at today’s rate only 400 would be carbon dioxide. Since the Industrial Revolution, well over 600 thousand million tonnes (or gigatonnes - Gt) of carbon have been emitted into the atmosphere, the result of fossil fuel burning, increasing levels from 280 ppm in pre-industrial times to 400 ppm, a rise of 43%, a greater concentration than for at least 650,000 years[9]. Argon, nitrogen and oxygen, which together comprise over 99% of the earth’s atmosphere, neither absorb nor emit radiation. Why?[10]
In the case of argon (chemical name Ar, fractional volume in the atmosphere 0.934%), the reason is that it exists in the atmosphere as an atom, and its energy levels are widely spaced. This means that the only photons it can absorb are of quite high energy, and this places them in the ultraviolet part of the spectrum. Hence, argon is not a greenhouse gas. Recall that greenhouse gases absorb in the infrared or longwave form of radiation.
Atoms and molecules have energy levels or ‘states’ generally determined by quantum mechanics. They may then undergo a ‘transition’ from one state to another by absorbing or emitting a photon of light which has just the right amount of energy, hence wavelength. These energy levels, or rather the difference between them, determine what wavelength of light an atom or molecule absorbs.
On the other hand nitrogen (N2, fractional volume 78.084%) and oxygen (O2, fractional volume 20.946%) can rotate and vibrate, but they are not greenhouse gases. They are homoneuclear molecules, making them electrically symmetric. This means that the electric field of the light beam (the electromagnetic radiation) cannot ‘get hold of’ the molecule, a key part pf the process of absorption or emission. Thus neither is radioactively active, but for a different reason than in the case of argon.
And so we are left with just the ‘trace gases’ water vapour (up to 4%) and carbon dioxide (CO2, now 415ppm) to shoulder the burden. These greenhouse gases have the capacity to absorb just the right amount of energy, making them radiatively active in the infrared or longwave form of radiation. When some of this radiation is re-radiated back to the surface, the Earth's 'effective temperature" is raised and rendered out of balance.
As at 11 May 2019, according to sensors at the Mauna Loa Observatory, a research outpost of the National Oceanic and Atmospheric Agency (NOAA), based on Arctic ice-core data pre-1958 and Mauna Loa data thereafter, those CO2 levels had risen to 415.26 ppm, the highest they have ever been, not just in recorded history, not just since the invention of agriculture 10,000 years ago, but since before modern humans existed millions of years ago! "We don't know a planet like this".
The last time the Earth experienced these levels was during the Pliocene Epoch, between 5.3 and 2.5 million years ago. Then, global temperatures were 2 to 3 degrees Celsius higher, and the sea levels 25 metres higher. Pollution from climate change today is on track to push the Earth towards similar conditions. "To many Australian voters, this reality is too much to fathom, presumed to be a hoax, or utterly unknown".
Some people argue that periodic trends downwards in climate warming, eg following 1998, prove that the overall science of climate change is a fallacy, but this line of reasoning is itself fallacious because climatic trends are typically measured in at least 30+ year cycles. Climate warming is not inevitably linear and short term fluctuations do not show the long term trend, as illustrated below.
The relentless rise of carbon dioxide: NASA global climate change
The global record no one wanted and very few can fathom!
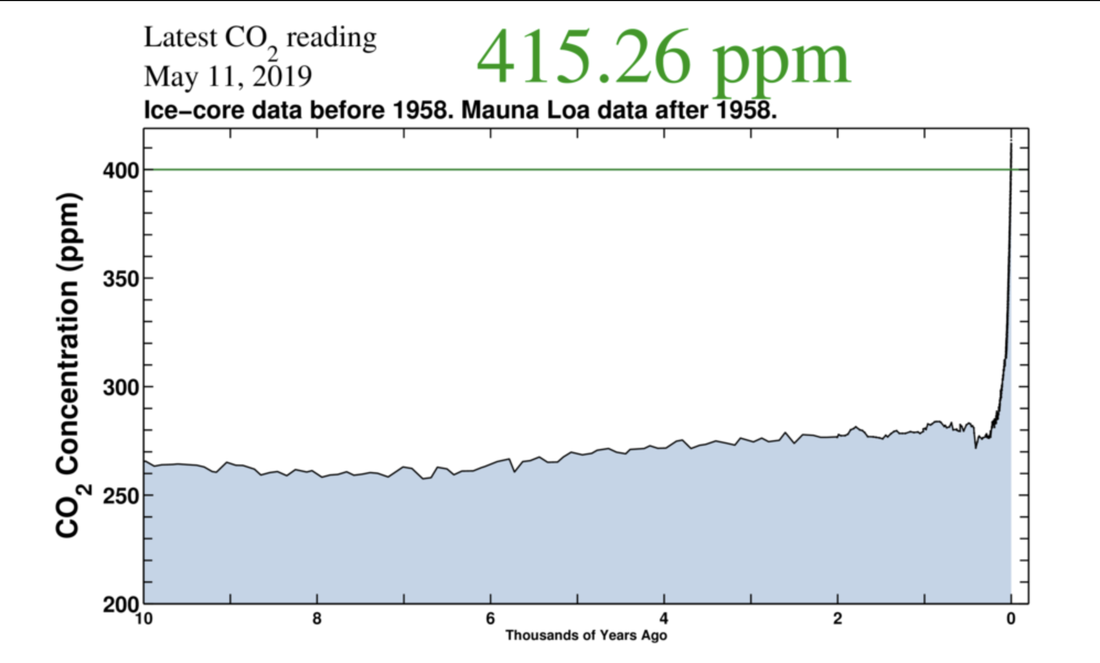 CO2 emissions over time as recorded by measurements of Arctic ice and the Mauna Loa Observatory. Courtesy of the Scripps Institution of Oceanography. Source: https://techcrunch.com/2019/05/12/co2-in-the-atmosphere-just-exceeded-415-parts-per-million-for-the-first-time-in-human-history/
The rise in the rate of acceleration was anticipated to increase by up to 10% in 2020, in part because of the carbon being released by the Australian bushfires, which was expected to contribute up to one-fifth of this increase. As a result, atmospheric concentration of CO₂ was anticipated to peak above 417 parts per million in May, while the average for the year was forecast to be 414.2 ppm, with a range of plus or minus 0.6 ppm, the UK Met Office said.
But there was a joker in the pack nobody knew about. Initially, the figures stood virtually unchanged since the year before: 415.20 ppm as at 16 July 2020. However, by 10 September 2020, with Covid-19 and lesser aviation emissions, the figure had declined marginally to 411.01 ppm. For the up to date figures, see https://scripps.ucsd.edu/programs/keelingcurve/; https://www.esrl.noaa.gov/gmd/ccgg/trends/weekly.html
[1] https://climate.ncsu.edu/edu/k12/.LWSW
[2] Latent heat is the energy needed to convert 1 kg from one phase to another: solid to liquid, liquid to gas, solid to gas. Change of state refers to the physical process where matter moves from one state to another, for example melting, evaporation, boiling, condensation, freezing, crystallization, and sublimation.
[3] For the graphic, see https://en.wikipedia.org/wiki/Earth's_energy_budget. A concurrent source with explanation is also drawn from Michael Box’s WEA lectures “Our Atmospheric Environment” (May-June 2017) at 2.2.2.
[4] The effective temperature of a planet is the temperature it would have if it acted like a so-called black body, absorbing all the incoming radiation received at its surface and re-radiating it all back to space. For how this is calculated, see http://eesc.columbia.edu/courses/v1003/lectures/solar_radiation/effective_temp.html For a body which is not black such as the earth, this may be interpreted as an “effective (or radiative) temperature”.
[5] https://en.wikipedia.org/wiki/Radiative_forcing
[6] https://en.wikipedia.org/wiki/Aerosol; See also Box, op cit, 3.4.
[7] Box, op cit 5.1.5
[8] Most of the water vapour in our atmosphere arises from evaporation of the ocean surface and is not directly affected by human activities. Carbon dioxide is different and also arises from deforestation.
[9] Houghton, op cit. 35-36.
[10] The ensuing explanation is drawn from Associate Professor Michael Box’s WEA course, “Satellite Observation for weather and climate”, 18 July 2019.
Next
