Australia's position
The economy
According to the OEC (the Observatory of Economic Complexity), Australia's top exports are Iron Ore ($48.2B), Coal Briquettes (coal, black coal, hard coal, stone coal) ($47B; thermal coal $25 billion), Gold ($29.1B), Petroleum Gas ($20.3B) and Wheat ($4.88B). Its top imports are Cars ($18.1B), Refined Petroleum ($14.4B), Special Purpose Ships ($9B), Broadcasting Equipment ($7.22B) and Delivery Trucks ($6.8B). Australia is the second largest producer of thermal coal after Indonesia.
That 47 billion a year for coal might sound impressive but foreign tourists spent around the same amount here in the year to the end of June 2019. Coal mining also accounts for the employment of some 47,000 people, but according to DFAT estimates this is dwarfed by the 646,000 Australians directly working in tourism alone, some 14 times more than the number employed in coal mining.
On the energy front, the national energy market in 2019-2020 comprised 74 per cent coal, six per cent gas, 4 per cent solar, 10 per cent wind and 5 per cent hydro, but this is changing rapidly. Over the next 20 years, 61 per cent of Australia’s ageing and increasingly expensive coal fired capacity is set to be shut down and mainly replaced by cheaper renewable energy with dispatchable back-up that can enter the grid as required at short notice. As an indicator that the writing for coal may already be well and truly on the wall, Australia's youngest coal-fired power station, Bluewaters in Western Australia, bought by a Japanese company for about $1.2 billion less than a decade ago, has already been written off as worthless by its owners. Alternatives proposed by the Energy Security Board (ESB), established by COAG in August 2017, include not just large scale power generation but also firm dispatchable resources like hydro power, batteries and fast-start gas plants for when the sun isn’t shining or wind isn’t blowing.
So coal mining contribution is not as significant for our future as is sometimes suggested - in 2019 it accounted for only 38,000 workers, a sliver of the nation's 12 million strong workforce - and it is set to decline significantly in future years as renewables take over. Our coal reserves themselves are also being worked out at a steady rate. The problem is how to achieve a so-called "just transition" from one energy source to the other, particularly in a country like Australia "where there is no such thing as a working relationship between employers, trade unions and states, and where a confrontational rather than a consensus attitude prevails". Even so, the Minerals Council of Australia admits that, at current production, Australia will be exhausted of black coal within 125 years. And at the same time, many of Australia's key thermal coal export destinations including China, Japan and South Korea, are transitioning away from coal-powered electricity generation.
Our emissions
Against this background, look at the story with our emissions. In 2017, Australia pumped out 533.7 million tonnes of greenhouse gases into the atmosphere, a 7 year high[2]. In 2018, the figure was 538.2 million tonnes and our national figures for the 12 months to March 2019 revealed that ghg emissions exceeded those of any year since the 2012-13 financial year.
However, for the 12 months to September 2019, emissions were about 0.2 per cent lower – or 0.6 Mt CO2-e – than the previous year, thanks to record levels of renewable energy, primarily in the electricity sector. This represents the first drop in Australia's greenhouse gas emissions since 2015, but if maintained at that rate, the rate of decline would mean that the country would not meet its Paris target to reduce greenhouse emissions based on 2005 levels by 26 per cent before 2030 until 2098, 68 years too late!
The official figures to June 2020 also show a decline to 513.4 million tonnes for the previous 12 months, down from 529.5 million the previous year, an annual fall of 3% and the lowest level since 1998. The biggest change over the past year came in the three months to the end of June, when emissions fell to 122.7 million tonnes compared to 129 million in the March quarter. This was partly the result of a 7.9 per cent annual decline in petrol consumption associated with the impacts of the COVID pandemic, but the shift to renewable electricity is more important over time. The annual greenhouse gas output is 16.6 per cent below the levels of 2005, the baseline year for the Morrison government’s pledge to reduce emissions by 26 to 28 per cent by 2030. Australia's emissions projections for the year 2020 may be found at: https://www.industry.gov.au/publications/australias-emissions-projections-2020
Putting all this into context
Australia's relatively small contribution to global emissions, 1.3% (1.2% according to the government's latest data for the year ended 30 June 2019), might appear low, but we make up just 0.3% of the world's population, so the carbon intensity per head of population is actually quite high, one of the highest in the world. The chart below drawn from Sir John Houghton's Global Warming - the Complete Briefing [1], would tend to suggest that until recently we have been the word's highest per capita emitter.
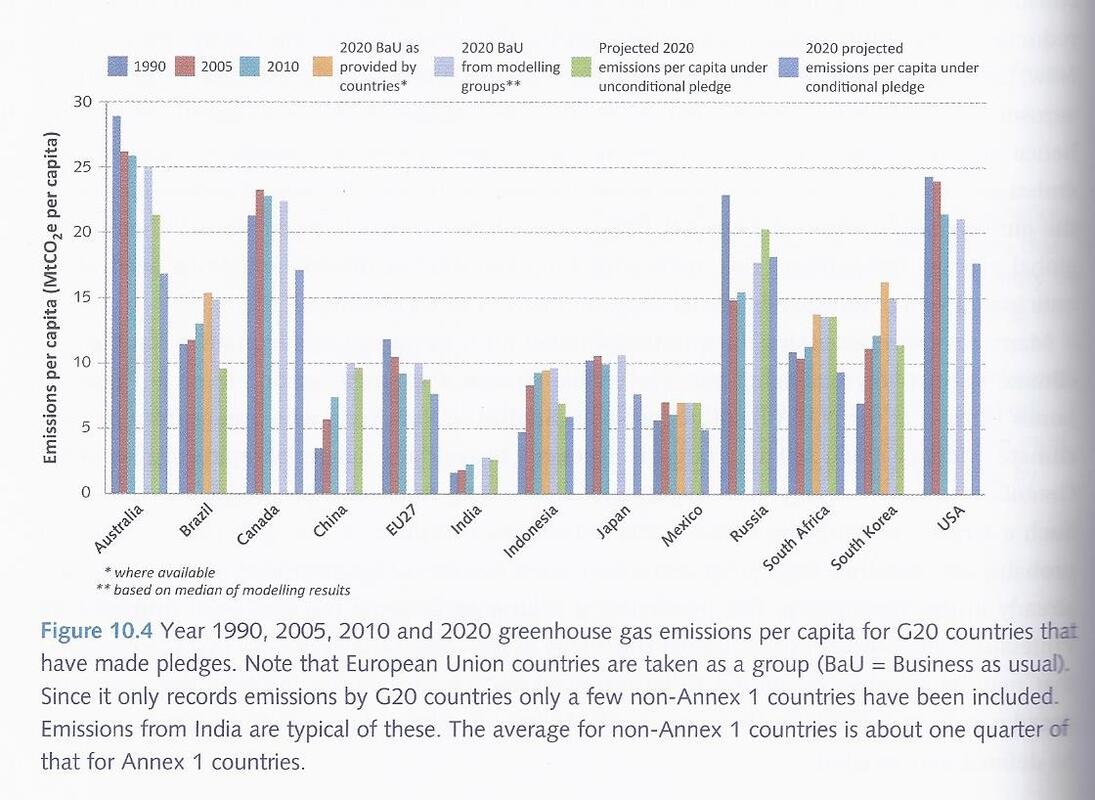
In fact, in 2016 Australia won a silver medal, a dead heat with the United States and was just pipped for the gold by Saudi Arabia on the list of the top 20 highest per capita emitters of carbon dioxide, and Australia's per capita emissions among its major trading partners also shows little to be proud of, although there is a projected downward trend due more to advances in technology and increasing population than anything positive on the emissions front itself:
 Australia remains the highest per-capita emitter in the selection of countries shown above. Source: http://climatecollege.unimelb.edu.au/facts4paris-australias-capita-emissions-remain-highest-among-its-key-trading-partners
But we need not have worried about that silver medal. By 2020 the gold was safely back in our hands once. Have a look at these more recent figures from the Australia Institute using data from Germany’s Potsdam Institute for Climate Impact Research (PIK):
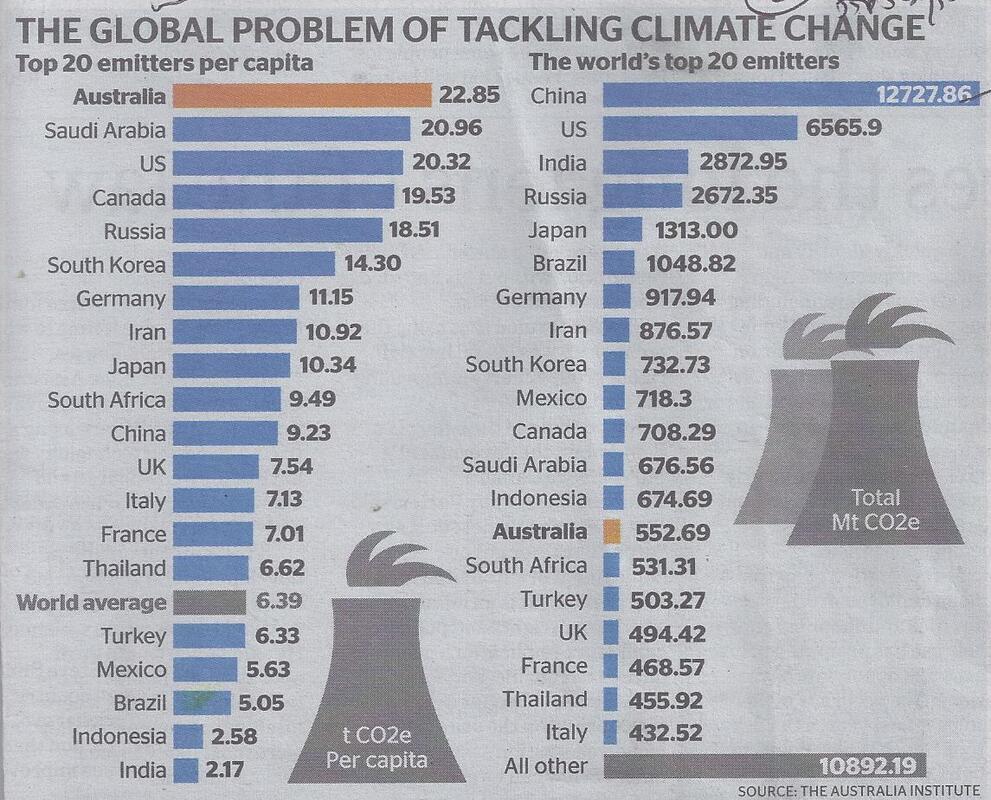 Source: Tom Hannam, "Australia's excuses have worn thin - we must do more to cut emissions", Sun-Herald, 26 January 2020.
https://www.brisbanetimes.com.au/environment/climate-change/australia-emits-1-2-percent-of-the-world-s-greenhouse-gases-so-who-must-act-to-cut-emissions-20200124-p53ub1.html
Source: Tom Hannam, "Australia's excuses have worn thin - we must do more to cut emissions", Sun-Herald, 26 January 2020.
https://www.brisbanetimes.com.au/environment/climate-change/australia-emits-1-2-percent-of-the-world-s-greenhouse-gases-so-who-must-act-to-cut-emissions-20200124-p53ub1.html
Assessed on a per capita basis, Australia now ranks as the highest emitter of all, and while we may say that Australia’s emissions are “low”, Australia is the 14th-largest emitter overall. That may not sound a lot but, as the Australia Institute's Tom Swann points out, if all the countries polluting less than Australia are taken together, they would account for 30 per cent of global emissions, or more than China's 27 per cent share. China, the US, the EU and India emit about 60 per cent of the world's total – and they all need to take action to cut back – but the emissions of the rest also matter.
A December 2019 ABC article entitled "See how global warming has changed since your childhood" by Tim Leslie, Joshua Byrd, and Nathan Hoad makes much the same point, with a slight variation in the figures:
"At home, Australia emits less than 1.24 per cent of global emissions, but so do most countries. More than 170 countries emit less than Australia each year, and combined, this group of countries emits more than any of the largest emitters — 40 per cent of all emissions come from countries that each emit less than 2 per cent of global emissions. So, even if the major emitters decarbonise, it won’t be enough".
Australia has done worse with rising emissions than all but seven OECD nations since 2005 - a date arbitrarily chosen by the Abbott government as a base year for Australia's Paris climate pledge, since it was a relatively high-emissions year. The proposal to cut pollution 26-28 per cent by 2030 would have been more like 17-19 per cent if 2000 emissions were the starting point. Turkey was up 56%, Chile 32%, Korea 24%, Iceland 20%, Mexico 18%, Israel 10%, Estonia 9% and Australia 6%.
This country is also the world's largest exporter of coking coal used to make steel, the second-largest exporter of thermal coal burnt in power stations and, since last year, the biggest gas exporter. These fuels are burned in other countries and the greenhouse gases from them counted against others' ledgers – "not that the atmosphere cares"..
The "carry over credits" loophole
In computing its emissions Australia is insisting on its "right" to calculate its emissions reductions by using the accounting trick or loophole of "carry-over credits" from a different climate treaty: the Kyoto Protocol, the effect of which would be that it only needs to achieve about 10% of its Paris commitment of 26% below 2005 levels by 2030. This insistence was instrumental in sabotaging COP 25, the second meeting of the parties to the Paris Agreement (and the 25th UN Climate Change Conference), designed to lay out the pathway ahead before the Paris Agreement is due to take effect.
At Kyoto, Australia negotiated an easy emissions target for itself and exceeded it, so it now seeks to carry over this so-called excess of carry-over credits, but as Ross Garnaut points out: "Anything that keeps actual emissions in 2030 higher rather than lower will make achievement of the ultimate target more difficult and costly, and that is a good reason why Australia should reduce emissions by much more than 26 per cent to 28 per cent, no matter what the rules are about the use of carryover of credits from earlier targets. The later you take action, the costlier it will be to reach zero emissions by 2050, as agreed at Paris."
See also Emission reduction: how Australia's efforts are viewed internationally.
[1] Fifth Edition, 2015, Cambridge UP, page 284.
[2] Bernie Fraser, former chair of the Climate Change Authority, and former Reserve Bank Governor: https://www.smh.com.au/federal-election-2019/former-rba-chief-slams-coalition-s-crazy-climate-claims-20190418-p51fgl.html; Nicole Hasham, "How do Labor and the Coalition plan to cut emissions:", SMH, 13 May 2019: https://www.smh.com.au/federal-election-2019/how-do-labor-and-the-coalition-plan-to-cut-carbon-emissions-20190429-p51ic8.html
Next
